75% Population drinking contaminated water

Central Bureau of Statistics (CBS) conducted a national level survey, Nepal Multiple Indicator Cluster Survey 2019 (NMICS 2019) from May to November 2019. It was a part of sixth-round of the global MICS household program.

NMICS 2019 provides valuable information and the latest evidence on the situation of children and women in Nepal. The survey presents data from an equity perspective by indicating disparities by sex, province, location, education, household wealth, functional limitation and other characteristics.

NMICS 2019 interviewed 12,800 households, of which 14,805 were women aged 15-49, 5,501 were men aged 15-49, 6,658 were mothers/caretakers of children under-five years, and 7,792 mothers/caretakers of children 5-17 years. The survey also performed water quality testing for E. coli and arsenic in 2,536 households.

Survey report says 68.7% population of age group 15-24 years are living happily. Similarly 63.4% population of age group 15-49 years said they are living happily. 97.1% of population use improved source of drinking water. 75.3% of population using improved source of drinking water tested with E. coli contamination, out of this 89.1% was in Karnali Province. Similarly, 90.3% of women and men of age group 15-24 years are able to read a short statement about everyday life. Out of this only 70.6% of women in Province 2 are able to read and write. 89.9% of total population has access to electricity with Karnali Province counting the least, 44.9%.

CBS claims that the findings of the survey will be used to monitor 15th Five Year Development Plan (2076/77-2080/81) of Government of Nepal, establish Multidimensional Poverty Index (MPI) 2020. It will also contribute to the voluntary national report (VNR) as well as the UN Secretary-General’s report to UN general assembly on the achievements of Sustainable Development Goals. The survey was conducted with the technical and financial support from United Nations Children’s Fund (UNICEF) Nepal.

Trend of Coffee Import and Export in Nepal

Trend of Coffee Import and Export in Nepal

Coffee import and export in Nepal is gradually trending towards increasing import while it is gaining popularity among urban population. Increasing number of crowds in well-designed coffee shops in urban centers proves its popularity. In fact coffee is the most consumed drinks and one of the most traded commodities in the world. Globally, consumption is estimated at over 2.25 billion cups per day. In our context, Nepal consumes 250 metric tons of coffee in average per year.

But before it gets to our morning cup, coffee beans travel through a complex global and local supply chain. There are two types of coffee plants-
• Coffee Arabica: complex flavor and less caffeine, and its used mostly in specialty and high quality drinks as Arabica coffee.
• Coffee Canephora: strong and bitter flavor, easy to grow, and is most frequently used in espressos and instant blends as Robusta coffee.

Coffee berry is stripped down to green beans and shipped from producing countries to a global supply network.

Coffee produced in Nepal is of Arabica variety. It is considered as specialty coffee for its distinct aroma and body and is grown in high altitude area above 1,000 meters up to 1,600 meters. Nepalese coffee is organic and eco-friendly. Small farmers are involved in its plantation. Until 2000 AD coffee plantation and production was an adventure in Nepal. Farmers were not sure of coffee being a source of income or income generating crop. Coffee was produced and processed only for domestic market. After the year 2002, coffee import and export in Nepal has substantially changed due to domestic consumption and motivated coffee producers considering coffee as one of the major income generating crops.

According to National Tea and Coffee development board Nepal produce an average of 470 metric tons of coffee per year. It is cultivated in about 40 districts of the mid-hills. Syangja, Nuwakot, Gulmi, Palpa, Kaski, Kavrepalanchowk, Arghakhanchi, Tanahu, Baglung, Gorkha, Lalitpur are major districts known for coffee production. According to a study done in 2018 Gulmi, Sindhupalchok and Baglung are the top three districts with largest areas classified as highly suitable for coffee cultivation. The study revealed that a total of 424 Palika from 62 districts have some area suitable for coffee cultivation.

Coffee import and export in Nepal

Looking into the trend of coffee import and export in Nepal, the country exports 112 metric tons of coffee per year in an average. In the year 2018/19 Nepal exported 84 metric tons of coffee to different countries. It is a very small share in the global coffee market and production. Germany, Japan, US, Australia, Netherland, Switzerland are major markets of Nepalese coffee.

Nepal made a record breaking import in trade history of Coffee in the year 2018/19. 1262 metric tons of coffee was imported this year. Coffee import to Nepal was 163 metric tons, the highest ever, in fiscal year 2017/18. Nepal imports an average of 80 metric tons of coffee every year from India, China, Brazil, Thailand, Korea, United Kingdom etc. Coffee import from India is consistently the highest in last decade.

Coffee isn’t just a drink; after all, it’s a business. Small farmers as well as individuals involved in coffee processing and marketing are shareholders of entire coffee business. Nepal has a favorable climatic condition for its cultivation. Technical and financial support to the farmers involved in coffee cultivation will increase the share of coffee in the economy of Nepal.

99.4% of total coffee import is from India and 0.6% is from other countries as below:
Survival is a New Challenge

Survival is a New Challenge

‘Corona pandemic has been no threat to government officials & local governments, an opportunity to power brokers & playground for politicians in terms of survival. What about entrepreneurs & private-sector dependents? Are we only the tax producers? Survival is a new challenge.’– Raj Shrestha an entrepreneur.

This is a representative voice by an entrepreneur holding a private company, suddenly moved to a remote working mode with no timeline as to when-or if-they‘d be going back to the office. Lockdowns have spurred digital workarounds in some workplaces and schools but in countries like Nepal where internet access is very low many people are left behind. This global crisis is affecting citiesindustriessmall and large businesses, and the lives of vulnerable people globally. It is changing the world in unprecedented ways. The pandemic has supercharged the economic collapse caused by poverty and conflict and placed the largest burden on the vulnerable. There is weak social protection for working-class citizens in countries like Nepal. Government policies are favored by corporations. The gap between the richest and poorest is widening. Covid-19 pandemic has created plenty of problems for employees working on self and for various private companies. How could companies survive to maintain that intangible but powerful aspect of their regular business environment? 

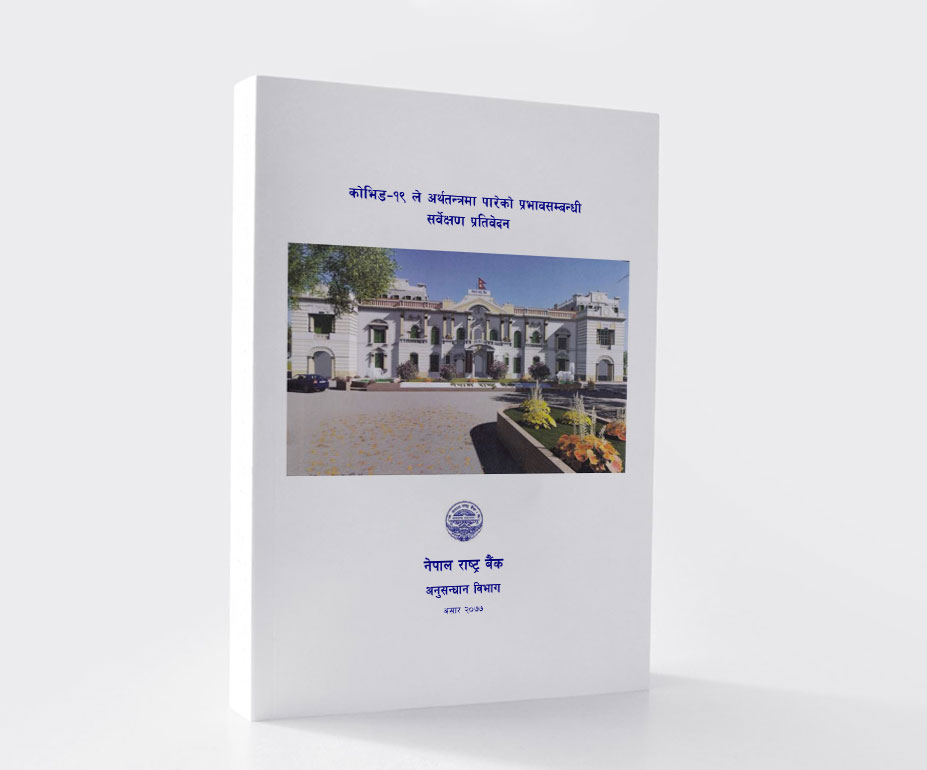
new survey conducted by the research department of Nepal Rastra Bank (NRB), the central Bank of Nepalsought to understand how company culture had changed since Corona Pandemic began. The Federal Government of Nepal announced a lockdown on 24 March 2020. All social and economic activities were stoppedPeople all over the nation and in foreign were stranded where they were. On 15th June lockdown was lifted partially. But economic activities have not yet come to normal. The NRB survey shows the effects and concerns about reopening workplaces, employee‘s wagesnumber, and salary cut off, unemployment, etc. 
674 industries and companies from 52 districts participated in the survey. 61% of the companies were found fully closed, 35% were running partially and 4% were in full operation. 

Data Outlook

Companies and industries who participated in the survey have cut off (22.5%) One-fourth of their staff, many of them temporary and in contract.

73.8% decrease in production/business was reported during the survey by the 96.7% of the industries/companies who participated in the survey.

Debt to total assets ratio of the industries/companies is 48.7%.

74.3% has loan from banks and other financial institutions.

8.7% has loan from savings and credit cooperative.

12% has no loan

22.5% employees have lost their job. Most of them are from Hotel and Restaurant sector.

Salary reduction in an average of 18.2% (mostly hotel, restaurant, transport, education sector)

It will take 9 months for industries and companies to run normally as before.

82.3% industries and companies have decided to continue same business after lockdown.

Businesses Open during Corona Pandemic (in %)

Among the 674 industries and companies from 52 districts who took part in the survey.

Companies and industries that participated in the survey have cut off One-fourth of their staff (22.5%), many of them temporary and contract-based. 96.7% of the industries/companies that participated in the survey said there was a decrease of 73.8% in production/business. The debt to total assets ratio of the industries/companies was found to be 48.7%. 74.3% of companies/industries have a loan from banks and other financial institutions. 8.7% of companies/industries have a loan from savings and credit cooperative. 12% of companies are running without a loan. 22.5% of employees have lost their jobMost of them are from Hotel and Restaurant sector. On an average 18.2% Salary was reduced by mostly hotelrestauranttransport, education sector. It will take 9 months for industries and companies to run normally as before. 82.3% of industries and companies have decided to continue the same business after lockdown. 

The impact of the current crisis is not temporary but is likely to induce lasting changes in the way that economies operate says, Nepal Development Update (NDU), a report published by World Bank. Recently published NDU indicates that ‘economic support to firms will be important to generate employment and pivot them towards a greener economy while managing debt overhang. In the relief stage time-bound, liquidity support should be provided to the most affected firms to increase employment. The agriculture and tourism sectors could be prioritized, given their criticality for food security and employment. In the restructuring stage, continued support to firmsincluding through recapitalization, will be neededPrivate-sector recovery can be supported through targeted investments in digitization and by providing fiscal incentives for green investments. In the resilient recovery stage, efforts need to be aimed at strengthening physical, digital, and financial infrastructure to develop e-commerce platforms, enhance access to finance and promote green growth.’
According to WB, COVID-19 had three effects on the monetary and financial sector in Nepal- 

First, it led to a drop in private sector credit: new loans to the private sector decreased by 64.7 percent between March and May 2020 compared to the same period the previous year, reflecting a slowdown in economic activities and limited service hours of bank branches during the lockdown. 

Second, new deposits – driven by individuals – grew by 82.8 percentreflecting precautionary savings and a deferment of tax payments. 

Third, monetary aggregates increased in May 2020 due to substantial growth in net foreign assets as COVID-19 led to a further decline in imports and an increase in foreign exchange reserves. 

The impacts of lockdown were felt across the economy. Industrial capacity utilization dropped from a pre-COVID baseline of 75-80 percent to 46 percent in June 2020. Daily peak energy consumption, which is closely correlated with industrial production, dropped from pre-COVID level of 1000 megawatts (MW) to 700 MW in June 2020 (NDU/WB). As per the NRB survey, 46.6 percent of companies/industries had 75 percent less energy consumption, 19.2 percent had 50% less energy consumption and 18.1 percent had 25 percent less energy consumption during the lockdown. 

According to NDU; remittance has dropped by 43.3 percent between mid-March to mid-May 2020 compared to the same period in previous years. This has affected private consumption and import of goods. There are millions of migrant workers in Arab Gulf countries. Global reports say almost 14% of the world‘s migrant workers live in the Middle East, where they are at high risk of exploitation as they have no guarantee of social security or pensions. The infection rate is highest among migrant workers, many who had already lost their jobsdue to the Coronavirus. Thousands of jobless Nepalese workers have returned home, and many of them are still waiting for the regular international flights to open in Nepal. The return of Migrant workers‘ has directly affected the country‘s economy as returned labor migrants have increased unemployment and created an excess supply of labor in the domestic labor market. 

The budget for FY 2021 has announced relief and recovery measures. As per the budget
A fund of NPR 50 billion will be created to provide concessional loans at the interest rate of 5 percent for the operation of business and payment of salaries for small and medium-sized industries and COVID-19 affected tourism sector. 

A discount of 25 percent on the electricity fee for individuals consuming electricity up to 150 units in a month and a discount of 15 percent for individuals consuming electricity up to 250 units in a month. The fee will be waived for individuals consuming electricity up to 10 units a month. A 50-percent discount will be provided on demand charges for industries during the lockdown period.

A provision will be made through the Nepal Rastra Bank (NRB) to provide a refinance facility of up to NPR 100 billion at the interest rate of 5 percent for COVID-19-affected industries in the agriculture, cottage, small and medium-sized enterprise, hotel, and tourism sectors.

The insurance policies of COVID-19-affected industries and transportation will be extended until the lockdown ends. Social security contribution waived for workers and firms during the lockdown period: The government will make contributions (on behalf of workers) to the contribution-based Social Security Fund during the lockdown period. Discounts will be provided on parking fees, airline licensing renewal fees, flight qualification certification charges and the infrastructure tax on aviation fuel.

According to the NRB survey, concessional loans at the interest rate of 5 percent as provisioned in the budget will be a good relief to the industries and companies. 

This will motivate the industrialists and entrepreneurs to operate and continue their business without cutting off the number of employees. Concession in interest rate, Flexible EMI, Tax rebate,

Additional loan facility for running capital, Flexibility to extend loan period is few other demands of the industries and companies to survive and continue their business fluently.

Download Report Here

Investment Gap in Agriculture

Investment Gap in Agriculture

Agriculture in Data

An agricultural holding is defined as an economic unit of agricultural production under single management comprising all livestock and poultry kept and all land used wholly or partly for agricultural production purposes. According to Nepal Sample Census of Agriculture 2011/12 there are 3,831,093 such agricultural holdings in Nepal. Compared to 2001/02 census there is an increase of about 13.89% (466993) holdings. This increase is very low than previous censuses, 23% in 2001/02 and 25% in 1991/92. In a span of 60 years, from 1961/62 to 2011/12 the number of holdings increased by 2.29 million. Nepal Outlook has taken this effort to bring together agricultural scenario and challenge in data.

However, there is a huge change in number of agricultural holdings; Nepal’s agriculture sector is still far behind from being commercialized and mechanized. Commercialization and mechanization of agriculture needs investment. Looking in to the data enumerated by the agriculture census the proportion of holdings availing agricultural credit to finance their farming is very low. Comparing previous year’s data there is no visible change seen in agriculture financing. In 1991/92 out of total holdings only 23% availed agricultural loan. Similarly in 2001/02 it was 24%. In 2010/11 it further dropped to 21.82%.

Growth of Financial Institutions (numbers) as of 21 August 2020

Financial Institutions 1990 2006 2007 2008 2009 2010 2011 2012 2013 2014 2015 2016 2017 2018 2019 2020
Commercial Banks 5 18 20 25 26 27 31 32 31 30 30 28 28 28 28 27
Development Banks 2 28 38 58 63 79 87 88 86 84 76 67 40 33 29 20
Finance Companies 70 74 78 77 79 79 69 59 53 48 42 28 25 23 22
Micro-finance Financial Institutions 11 12 12 15 18 21 24 31 37 38 42 53 65 90 85
Total 7 127 144 173 181 203 218 213 207 204 192 179 149 151 170 154

If we look at the table above we can see increase and decrease in its number of financial institutions. In 1990 there were only 7 financial institution including 5 commercial banks and 2 development banks. In 2011 there were 218 financial institutions. Currently there are 154 financial institutions, including 27 banks, 20 development banks, 22 finance companies, 85 micro finance development banks. These data do not include Insurance Companies, Infrastructure Development Bank, Citizen’s Investment Trust, Employ’s Provident Fund, Cooperatives and Other financial institutions licensed for financial intermediary operations. The existing provision requires commercial banks to disburse minimum 10 percent of their total credit to agriculture sector and minimum 15 percent to energy and tourism sector. Similarly there is policy provision for the development banks and finance companies to extend at least 15 percent and 10 percent of their total credits respectively to the priority sector. But table below shows that commercial and development banks are far below central bank’s mandate. Last three years data shows that agriculture sector loan did not exceed 6 percent in commercial banks.

Sector wise loan and advances of Commercial and Development Banks (mid  July 2019)


S.NSectorPercentage of Total Loan
201720182019
1Agriculture Forest4.234.65.26
2Fishery0.120.110.14


  Percentage of Total Loan
201720182019
1Agriculture Forest5.55.966.24
2Fishery0.130.130.21

These data’s show that however, number of financial institutions is increased in last two decades, agricultural financing is not satisfactory. Agriculture Census data shows that farmers had most of the source of credit from non-institutional or informal types of source likes relatives, private lenders and others. If we observe sources of credit we can see 34.57% of holdings borrowed agricultural credit from relatives, 5.78% from undisclosed sources, while 8.68% borrowed from commercial banks, 12.61% borrowed from Agricultural Development Bank/Nepal and 15.68% from savings and credit cooperatives. In total scenario, only 21.82% of agricultural holdings borrowed agricultural credit. That means still 78.18% of agricultural holdings have no agricultural credit or investment.

Number, area of holdings and number of holdings reporting agricultural credit by total area of holding


Number, area of holdings and number of holdings reporting agricultural credit by total area of holding

ProvinceHoldings with credit by main source (%)
No. of holdingsHoldings without agricultural credit %CooperativesADB/N Commercial Bank/financial institutionFarmer's groupWomen's groupRelativesOther
Province 171714879.4816.6216.7612.29.6412.3129.712.76
Province 267292773.769.6618.7511.023.978.4239.129.05
Bagmati65877679.5425.237.424.5412.7616.11312.93
Gandaki41330085.8419.9712.0410.557.0615.3133.221.86
Province 569729378.4514.8413.739.9510.1514.0132.454.87
Karnali26177072.1416.923.874.3413.319.342.929.34
Sudurpaschim40987976.669.67.484.9214.5517.4736.489.51
NEPAL383109378.1815.6812.618.689.7412.9534.575.78

Examining Provincial data, we can see 27.86% of holdings in Karnali Province have agricultural credit, the highest among the Provinces. Province 2 comes second with 26.24% and Sudurpaschim Province with 23.34%. Similarly, 14.56% of holdings in Karnali province have agricultural credits from relatives and individuals and only 7% of credit from financial institutions like commercial banks, ADB/N and cooperatives. Sudurpaschim province is among the provinces having least agricultural credit from financial institutions, which is 5.13%.

Investment in agriculture is directly related to production and food security. Less investment in agriculture results less production and high food insufficiency. Agriculture Census report reveals food insufficiency in various provinces, among all Provinces Karnali province has the highest insufficiency of own produce for household consumption, which is 74.71%. Similarly, Gandaki Province has 67.80%, the second highest insufficiency of own produce for household consumption. Overall scenario showed that 59.91% of holdings reported that they are insufficient in food from their own produce. So, how are farmers coping with year round insufficiency of food? Income earned through own non-agricultural business, wage earnings (within district and outside district), pension, borrowings and other means of earning are adopted by many of the farmers for livelihood.

Province Total number of holdings Percentage of holdings reporting insufficiency of own produce for  household consumption
Province 1 717148 57.01
Province 2 672927 57.69
Province 3 658776 54.28
Province 4 413300 67.80
Province 5 697293 56.66
Province 6 261770 74.71
Province 7 409879 65.85
NEPAL 3831093 59.91
Source: NATIONAL SAMPLE CENSUS OF AGRICULTURE 2011/12

 ‘A declining long term trend in public investment particularly in agricultural support and productivity limits the productive capability in the agriculture and its ability to benefit from the rise in output prices.’ (Prof. Dr. Pyakuryal Bishwamber ; ‘Nepal’s Development Tragedy Threats and Possibilities’)

However declining, Nepal’s agriculture sector still has highest share in GDP. And there is still huge number of population depending on agriculture for livelihood. To fill the investment gap in agriculture and productivity an urgent review of investment financing strategy is needed.

Distance learning an alternative education practice !

Distance learning an alternative education practice !

Covid-19 pandemic has changed the teaching and learning process. Online education and distance learning is evolved as a global education practice due to the COVID pandemic. COVID-19 was declared a Public Health Emergency of International Concern on March 11 2020 by World Health Organization (WHO). Since then many countries announced lock down. Millions of students got locked down at places where they are. Nepal announced full lock down on 24th March. Prior to this, Government of Nepal announced cancellation of Secondary Education Examination (SEE). Board exams of class XI got suspended and class XII is postponed till another notice.

Along with many other sectors education sector is highly affected by the COVID-19 pandemic. However, industries, market and offices re-opened after 90 days lock down, education institutions are still under full shut down. Some private schools started Online Classes using Zoom, Google meet as supportive applications. Similarly, TV/Local Cable stations and radio/FM stations are also teaching students through live sessions as optional teaching method. These methods of teaching through different media are targeted for students of public school in the remote. But teaching students through optional method is a big challenge in our context. There is a large vacuum regarding facilities necessary for online and other distance learning medium. Internet, TV, radio, FM and mobile phones are basic services and devices to initiate online and distance education.

Table below shows percentage distribution of various facilities available in households.

Residence/FacilitiesRadioTelevisionComputerInternetTelephoneMobile PhoneCable Television
Nepal51.737.17.43.47.565.819.7
Urban54.261.423.912.322.98554.4
Rural51.131.33.41.33.861.211.3
Mountain57.815.11.40.52.847.75.6
Hill603711.15.610.268.726.2
Terai4240.34.61.65.565.415.2

As per the table above only 3.4% of households have access to internet facility. Majority of household with access to internet facility is concentrated in urban centers. However, mobile phones are most common possession now day’s only 65.8% household in Nepal has mobile phones. Out of which 85% are urban and 61.2% are rural. Similarly only 19.7% households have access to cable TV, 7.4% have Computer and 51.7% have access to radio facility. (Population Monograph of Nepal, 2014, Vol III)

There are still many students who do not have access to any form of above mentioned media. Not just in the rural area, even urban dwellers have no access to modern gadgets. These data clarifies that online or distance learning is a big challenge in our context. Next, out of total students enrolled in various levels and school, only 26% students are in institutional schools. Currently, 74% students enrolled to public schools are unable to get proper education due to COVID pandemic. Besides most of the public schools are turned in to quarantine centers.

Child and Family Tracker survey by UNICEF Nepal shows that more than two-thirds of school children are deprived of distance learning. Only three out of 10 children have access to television, radio and Internet-based learning platforms. Among them, only 80 per cent of children use distance learning platforms for their learning activities. Survey further shows that poorer the household, the less likely it is that children can access or will use distance learning. The data shows that only five per cent of children in the poorest households have access to and use distance learning.

To overcome with the problem of education sector during pandemic Nepal government has developed COVID-19 Education Cluster Contingency Plan 2020 (ECCP). Three education-specific scenarios is anticipated by the ECCP in case of extended school closure; (i) up to mid-July, (ii) up to September 2020, and (iii) for the majority or entire duration of the 2020-21 academic year.

Table below developed by ECCP shows a projection of affected children i.e. how many children will be affected or will be in need of support.

LevelAffected populationProjected increase in drop-out (in the three scenarios) #colspan#Children with internet accessChildren with access to mediaChildren with no access to mediaChildren most vulnerable/ at risk
123
3-4 years (ECED/PPE) 97390077912194780292170128044474102280080129599
5-9 years (Grade 1-5) 3672155282737706843106026446286917897171078690468202
10-12 years (grade 6-8) 1820943160700401751602626233073886417523772207304
13-14 years (grade 9-10) 10275123359383983125974132151500890294331119862
15-16 years (grade 11-12) 6315362023750593758898325730714318108670123
Total 812604657517914379492156923109339439582702357959995090

Table above shows an alarming picture of school level education. If entire duration of the 2020-21 academic years is lost, number of drop-out students will be more than 2.15 million. Similarly, 8.12 million children will be affected due to school closure. Specially, many girls will discontinue education. In the past few years Nepal has gained a lot of praise for high enrollment of new students, especially girls, to schools. The challenge still remains. COVID-19 pandemic has added more challenge to enrollment of new students to school and dropout rate is projected to increase due to school closure.

Remote Learning Reachability Report published by UNICEF urges governments to prioritize the safe re-opening of schools when they begin easing lockdown restrictions. When reopening is not possible, UNICEF urges governments to incorporate compensatory learning for lost instructional time into school continuity and reopening plans. School opening policies and practices must include expanding access to education, including remote learning, especially for marginalized groups. Education systems must also be adapted and built to withstand future crises.