Potentially dangerous glacial lakes in Nepal

Himalayan glaciers are vulnerable to the warming climate and have been melting and retreating at unprecedented rates since the mid-20th century, impacting flow regimes in major river basins. These changes lead to the formation of new glacial lakes as well as the expansion of existing glacial lakes, increasing the risk of glacial lake outburst floods (GLOFs).

Recorded information on GLOF events shows an increment in the frequency and magnitude of these disasters in recent decades. If current warming trends and unchecked developmental activities continue, the occurrence of GLOFs and other glacial hazards could escalate, adversely impacting water availability.

ICIMOD and UNDP Nepal have prepared a comprehensive inventory of glacial lakes and identified the potentially dangerous glacial lakes in major river basins of Nepal, including the upper reach of these basins from the Tibetan Autonomous Region of China.

According to the report historically, GLOFs have had catastrophic consequences in Nepal – directly and through cascading impacts (landslides, erosion, and sedimentation) – leading to the loss of lives and livestock and damaging infrastructure and transportation routes. Twenty-six GLOF events have been recorded in Nepal since 1977 and 11 of these have had transboundary impacts.

The study found 3624 glacial lakes located in the three basins, of which 2070 lakes are in Nepal, 1509 lakes in the Tibet Autonomous Region, China and 45 lakes in India. As many as 1410 lakes are larger than or equal to 0.02 km2 which are considered large enough to cause a glacial lake outburst flood (GLOF).

Study identified Forty-seven glacial lakes as potentially dangerous glacial lakes (PDGLs) based on the following criteria: (i) characteristics of the lakes and their dams; (ii) the activity of the source glacier; and (iii) morphology of the surroundings.

According to ICIMOD the number of glacial lakes in the Koshi basin has increased from 1,160 in 1977 to 2,168 in 2010; their total area has increased from 94.4 km2 to 127.6 km2 over this period. The number of lakes has increased by 86.9% and the total lake area by 35.1%. The number of glacial lakes in the Koshi basin decreased from 2,119 in 2000 to 2,087 in 2005 and to 2,064 in 2015. The number of glacial lakes has increased in the Gandaki basin, from 377 in 2000 to 405 in 2005, and 432 in 2015. The increase in the number of glacial lakes is indicative of the rapid melting of glaciers and formation of new lakes, particularly those dammed by glacier ice and moraines. The glacial lakes in the Karnali basin increased from 1,105 in 2000 to 1,204 in 2005 but decreased to 1,128 in 2015.

Out of 3,624 lakes mapped, 1,410 lakes are equal to or larger than 0.02 km2. This is considered large enough to cause damage downstream were the lake to rupture. This potential is heightened if the lakes are associated with a large and retreating glacier. Of the 1,410 lakes, 1,358 lakes were removed, based on the damming condition, the activity of the source glaciers, and their surroundings. The remaining 52 lakes were analysed further to identify potentially dangerous glacial lakes. Eventually, 47 glacial lakes were identified as potentially dangerous. These include 42 lakes in the Koshi, 3 in the Gandaki, and 2 in the Karnali basins. With respect to political boundaries, 25 PDGLs are in the territory of the TAR, China, 21 are located in Nepal, and one PDGL is in India.

According to the report the danger levels of the PDGLs are categorized into three ranks, with Rank I being the highest:

Rank I – Large lake and possibility of expansion due to the calving of glaciers; lake close to the loose moraine end; no overflow through the moraine; steep outlet slope; hanging source glacier; chances of snow and/or ice avalanches and landslides in the surroundings impacting the lake and dam.

Rank II – Confined lake outlet; lake outlet close to compact and old end-moraine; hanging lake; distinct seepage at the bottom of end-moraine dam; gentle outward slope of moraine.

Rank III – Confined Lake Outlet; gentle outward slope of the dam; large lake but shallow depth; moraine more than 200 m wide; old and compact moraine.

Based on this, of the 47 lakes reviewed, 31 lakes were classified as belonging to Rank I, 12 lakes as Rank II, and four lakes as Rank III.

 In the past the GLOF resulted in an estimated economic loss of US$ 1.5 million, destroyed infrastructure including the Namche hydropower plant, and caused a few casualties. Before that, in 1977, a GLOF was recorded in Dudh Koshi, causing 2‒3 casualties. GLOFs can also have transboundary effects. The Zhangzangbo–cho (Ciremacho Lake) in the TAR, China, was breached in July 1981 and destroyed the Friendship Bridge on the China‒Nepal highway, and the intake dam of the Sun Koshi hydropower station, causing serious economic losses in Nepal. Damages were estimated US$ 3 million at the time.

GLOF events that have caused damage in Nepal

S.No.DateRiver basinLocation
11980-06-23TamorNagma Pokhari
21981-07-11Bhote KoshiCirenmacho Lake Zhangzangbo Valley
31985-08-04Dudh KoshiDig Tsho
41991-07-12Tama KoshiChubung
51998-09-03Dudh KoshiSabai Tsho (Tam Pokhari)
62003-08-15MadiKabache Lake
72004-08-08MadiKabache Lake
82016-07-05Bhote KoshiTAR, China
92017-04-20Barun ValleyNear Lower Barun

‘Sales of Energy’-An Upcoming Challenge

Nepal Electricity Authority (NEA) celebrates 35 years of its service of power production, transmission and distribution. NEA claims the year 2019/20 as one more successful year in supplying continuous power to its consumers and maintaining sound financial health. After tumultuous years of losses NEA is now a profit making organization since 2016/17. Its system loss has come down to 15.27% from 25.78% in 2016. According to annual report of NEA for the year 2019/20 total population with access to electricity infrastructure has reached 86% of the total household. Total number of electricity consumers increased by 7.8% from 3.91 million to 4.22 million during 2019/20. These data does not include consumers under community rural electrification, which is serving about 0.57 million consumers in rural areas. Among the entire electricity consumers domestic consumers share the largest category with 93.24% share. Industrial consumer has a share of just 1.33% but has the highest share of 45.31% in revenue generation and 35.83% as sales share. Domestic consumer has 35.27% and 44.34% share in revenue and sales.

Two new power plants, namely Upper Trishuli 3A (60 MW) and Kulekhani III (14 MW) is added to the system contributing an increase in electricity generation. NEA’s hydropower plants including small power stations generated a total of 3021 GWh of electricity in FY 2019/20. It is an increase by 18.57% over the generation of 2548 GWh in FY 2018/19. There was a decrease of 38.55% energy import from India, 1729 GWh in 2019/20 and 2813.07 GWh in 2018/19. The contribution of energy imported from India contributed 22.33% out of total available energy. Total installed capacity of NEA is 1332 MW, including 14 major hydropower stations (563.15 MW), 17 small hydro power plants (14.244 MW), 23 small hydro power plants (isolated) (4.536 MW), 2 thermal power plants (53.41 MW) and 3 solar power plants (1350 kW).

According to reports from various directorates of NEA, Covid-19 pandemic and the subsequent lockdown hampered in its regular growth. The effect of the lockdown has caused lesser revenue from the industrial sector.

 Since 2016/17 there was continuous decrease in load shedding. Before this we were forced to live in darkness with hours of load shedding. During the last four years Nepal has seen brighter times, helping countries economy to go forward. At the same time, it has also helped a great deal in saving valuable foreign currency reserve of the country which has been used to import batteries, inverters, solar panels and additional fossil fuels for generators.

As per the report, fulfilling the energy demand was the biggest challenge of NEA in the past. As per current status sale of energy is going to pose a serious challenge for NEA in coming year as 1000 MW of generation is to be commissioned by the year 2021 alone.

75% Population drinking contaminated water

Central Bureau of Statistics (CBS) conducted a national level survey, Nepal Multiple Indicator Cluster Survey 2019 (NMICS 2019) from May to November 2019. It was a part of sixth-round of the global MICS household program.

NMICS 2019 provides valuable information and the latest evidence on the situation of children and women in Nepal. The survey presents data from an equity perspective by indicating disparities by sex, province, location, education, household wealth, functional limitation and other characteristics.

NMICS 2019 interviewed 12,800 households, of which 14,805 were women aged 15-49, 5,501 were men aged 15-49, 6,658 were mothers/caretakers of children under-five years, and 7,792 mothers/caretakers of children 5-17 years. The survey also performed water quality testing for E. coli and arsenic in 2,536 households.

Survey report says 68.7% population of age group 15-24 years are living happily. Similarly 63.4% population of age group 15-49 years said they are living happily. 97.1% of population use improved source of drinking water. 75.3% of population using improved source of drinking water tested with E. coli contamination, out of this 89.1% was in Karnali Province. Similarly, 90.3% of women and men of age group 15-24 years are able to read a short statement about everyday life. Out of this only 70.6% of women in Province 2 are able to read and write. 89.9% of total population has access to electricity with Karnali Province counting the least, 44.9%.

CBS claims that the findings of the survey will be used to monitor 15th Five Year Development Plan (2076/77-2080/81) of Government of Nepal, establish Multidimensional Poverty Index (MPI) 2020. It will also contribute to the voluntary national report (VNR) as well as the UN Secretary-General’s report to UN general assembly on the achievements of Sustainable Development Goals. The survey was conducted with the technical and financial support from United Nations Children’s Fund (UNICEF) Nepal.

Survival is a New Challenge

Survival is a New Challenge

‘Corona pandemic has been no threat to government officials & local governments, an opportunity to power brokers & playground for politicians in terms of survival. What about entrepreneurs & private-sector dependents? Are we only the tax producers? Survival is a new challenge.’– Raj Shrestha an entrepreneur.

This is a representative voice by an entrepreneur holding a private company, suddenly moved to a remote working mode with no timeline as to when-or if-they‘d be going back to the office. Lockdowns have spurred digital workarounds in some workplaces and schools but in countries like Nepal where internet access is very low many people are left behind. This global crisis is affecting citiesindustriessmall and large businesses, and the lives of vulnerable people globally. It is changing the world in unprecedented ways. The pandemic has supercharged the economic collapse caused by poverty and conflict and placed the largest burden on the vulnerable. There is weak social protection for working-class citizens in countries like Nepal. Government policies are favored by corporations. The gap between the richest and poorest is widening. Covid-19 pandemic has created plenty of problems for employees working on self and for various private companies. How could companies survive to maintain that intangible but powerful aspect of their regular business environment? 

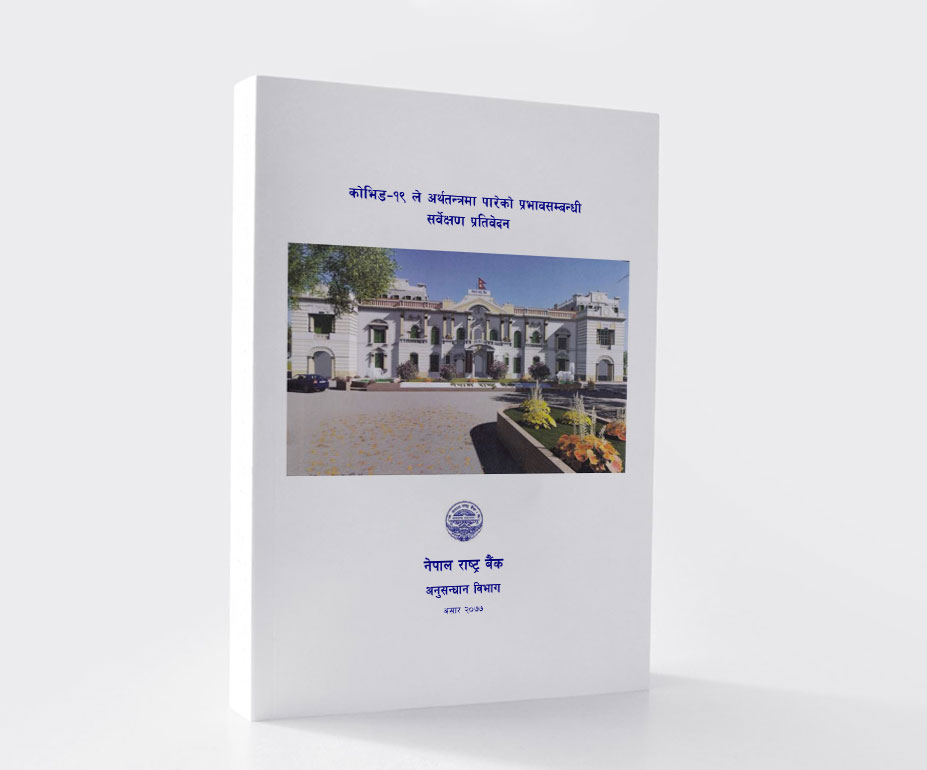
new survey conducted by the research department of Nepal Rastra Bank (NRB), the central Bank of Nepalsought to understand how company culture had changed since Corona Pandemic began. The Federal Government of Nepal announced a lockdown on 24 March 2020. All social and economic activities were stoppedPeople all over the nation and in foreign were stranded where they were. On 15th June lockdown was lifted partially. But economic activities have not yet come to normal. The NRB survey shows the effects and concerns about reopening workplaces, employee‘s wagesnumber, and salary cut off, unemployment, etc. 
674 industries and companies from 52 districts participated in the survey. 61% of the companies were found fully closed, 35% were running partially and 4% were in full operation. 

Data Outlook

Companies and industries who participated in the survey have cut off (22.5%) One-fourth of their staff, many of them temporary and in contract.

73.8% decrease in production/business was reported during the survey by the 96.7% of the industries/companies who participated in the survey.

Debt to total assets ratio of the industries/companies is 48.7%.

74.3% has loan from banks and other financial institutions.

8.7% has loan from savings and credit cooperative.

12% has no loan

22.5% employees have lost their job. Most of them are from Hotel and Restaurant sector.

Salary reduction in an average of 18.2% (mostly hotel, restaurant, transport, education sector)

It will take 9 months for industries and companies to run normally as before.

82.3% industries and companies have decided to continue same business after lockdown.

Businesses Open during Corona Pandemic (in %)

Among the 674 industries and companies from 52 districts who took part in the survey.

Companies and industries that participated in the survey have cut off One-fourth of their staff (22.5%), many of them temporary and contract-based. 96.7% of the industries/companies that participated in the survey said there was a decrease of 73.8% in production/business. The debt to total assets ratio of the industries/companies was found to be 48.7%. 74.3% of companies/industries have a loan from banks and other financial institutions. 8.7% of companies/industries have a loan from savings and credit cooperative. 12% of companies are running without a loan. 22.5% of employees have lost their jobMost of them are from Hotel and Restaurant sector. On an average 18.2% Salary was reduced by mostly hotelrestauranttransport, education sector. It will take 9 months for industries and companies to run normally as before. 82.3% of industries and companies have decided to continue the same business after lockdown. 

The impact of the current crisis is not temporary but is likely to induce lasting changes in the way that economies operate says, Nepal Development Update (NDU), a report published by World Bank. Recently published NDU indicates that ‘economic support to firms will be important to generate employment and pivot them towards a greener economy while managing debt overhang. In the relief stage time-bound, liquidity support should be provided to the most affected firms to increase employment. The agriculture and tourism sectors could be prioritized, given their criticality for food security and employment. In the restructuring stage, continued support to firmsincluding through recapitalization, will be neededPrivate-sector recovery can be supported through targeted investments in digitization and by providing fiscal incentives for green investments. In the resilient recovery stage, efforts need to be aimed at strengthening physical, digital, and financial infrastructure to develop e-commerce platforms, enhance access to finance and promote green growth.’
According to WB, COVID-19 had three effects on the monetary and financial sector in Nepal- 

First, it led to a drop in private sector credit: new loans to the private sector decreased by 64.7 percent between March and May 2020 compared to the same period the previous year, reflecting a slowdown in economic activities and limited service hours of bank branches during the lockdown. 

Second, new deposits – driven by individuals – grew by 82.8 percentreflecting precautionary savings and a deferment of tax payments. 

Third, monetary aggregates increased in May 2020 due to substantial growth in net foreign assets as COVID-19 led to a further decline in imports and an increase in foreign exchange reserves. 

The impacts of lockdown were felt across the economy. Industrial capacity utilization dropped from a pre-COVID baseline of 75-80 percent to 46 percent in June 2020. Daily peak energy consumption, which is closely correlated with industrial production, dropped from pre-COVID level of 1000 megawatts (MW) to 700 MW in June 2020 (NDU/WB). As per the NRB survey, 46.6 percent of companies/industries had 75 percent less energy consumption, 19.2 percent had 50% less energy consumption and 18.1 percent had 25 percent less energy consumption during the lockdown. 

According to NDU; remittance has dropped by 43.3 percent between mid-March to mid-May 2020 compared to the same period in previous years. This has affected private consumption and import of goods. There are millions of migrant workers in Arab Gulf countries. Global reports say almost 14% of the world‘s migrant workers live in the Middle East, where they are at high risk of exploitation as they have no guarantee of social security or pensions. The infection rate is highest among migrant workers, many who had already lost their jobsdue to the Coronavirus. Thousands of jobless Nepalese workers have returned home, and many of them are still waiting for the regular international flights to open in Nepal. The return of Migrant workers‘ has directly affected the country‘s economy as returned labor migrants have increased unemployment and created an excess supply of labor in the domestic labor market. 

The budget for FY 2021 has announced relief and recovery measures. As per the budget
A fund of NPR 50 billion will be created to provide concessional loans at the interest rate of 5 percent for the operation of business and payment of salaries for small and medium-sized industries and COVID-19 affected tourism sector. 

A discount of 25 percent on the electricity fee for individuals consuming electricity up to 150 units in a month and a discount of 15 percent for individuals consuming electricity up to 250 units in a month. The fee will be waived for individuals consuming electricity up to 10 units a month. A 50-percent discount will be provided on demand charges for industries during the lockdown period.

A provision will be made through the Nepal Rastra Bank (NRB) to provide a refinance facility of up to NPR 100 billion at the interest rate of 5 percent for COVID-19-affected industries in the agriculture, cottage, small and medium-sized enterprise, hotel, and tourism sectors.

The insurance policies of COVID-19-affected industries and transportation will be extended until the lockdown ends. Social security contribution waived for workers and firms during the lockdown period: The government will make contributions (on behalf of workers) to the contribution-based Social Security Fund during the lockdown period. Discounts will be provided on parking fees, airline licensing renewal fees, flight qualification certification charges and the infrastructure tax on aviation fuel.

According to the NRB survey, concessional loans at the interest rate of 5 percent as provisioned in the budget will be a good relief to the industries and companies. 

This will motivate the industrialists and entrepreneurs to operate and continue their business without cutting off the number of employees. Concession in interest rate, Flexible EMI, Tax rebate,

Additional loan facility for running capital, Flexibility to extend loan period is few other demands of the industries and companies to survive and continue their business fluently.

Download Report Here

Investment Gap in Agriculture

Investment Gap in Agriculture

Agriculture in Data

An agricultural holding is defined as an economic unit of agricultural production under single management comprising all livestock and poultry kept and all land used wholly or partly for agricultural production purposes. According to Nepal Sample Census of Agriculture 2011/12 there are 3,831,093 such agricultural holdings in Nepal. Compared to 2001/02 census there is an increase of about 13.89% (466993) holdings. This increase is very low than previous censuses, 23% in 2001/02 and 25% in 1991/92. In a span of 60 years, from 1961/62 to 2011/12 the number of holdings increased by 2.29 million. Nepal Outlook has taken this effort to bring together agricultural scenario and challenge in data.

However, there is a huge change in number of agricultural holdings; Nepal’s agriculture sector is still far behind from being commercialized and mechanized. Commercialization and mechanization of agriculture needs investment. Looking in to the data enumerated by the agriculture census the proportion of holdings availing agricultural credit to finance their farming is very low. Comparing previous year’s data there is no visible change seen in agriculture financing. In 1991/92 out of total holdings only 23% availed agricultural loan. Similarly in 2001/02 it was 24%. In 2010/11 it further dropped to 21.82%.

Growth of Financial Institutions (numbers) as of 21 August 2020

Financial Institutions 1990 2006 2007 2008 2009 2010 2011 2012 2013 2014 2015 2016 2017 2018 2019 2020
Commercial Banks 5 18 20 25 26 27 31 32 31 30 30 28 28 28 28 27
Development Banks 2 28 38 58 63 79 87 88 86 84 76 67 40 33 29 20
Finance Companies 70 74 78 77 79 79 69 59 53 48 42 28 25 23 22
Micro-finance Financial Institutions 11 12 12 15 18 21 24 31 37 38 42 53 65 90 85
Total 7 127 144 173 181 203 218 213 207 204 192 179 149 151 170 154

If we look at the table above we can see increase and decrease in its number of financial institutions. In 1990 there were only 7 financial institution including 5 commercial banks and 2 development banks. In 2011 there were 218 financial institutions. Currently there are 154 financial institutions, including 27 banks, 20 development banks, 22 finance companies, 85 micro finance development banks. These data do not include Insurance Companies, Infrastructure Development Bank, Citizen’s Investment Trust, Employ’s Provident Fund, Cooperatives and Other financial institutions licensed for financial intermediary operations. The existing provision requires commercial banks to disburse minimum 10 percent of their total credit to agriculture sector and minimum 15 percent to energy and tourism sector. Similarly there is policy provision for the development banks and finance companies to extend at least 15 percent and 10 percent of their total credits respectively to the priority sector. But table below shows that commercial and development banks are far below central bank’s mandate. Last three years data shows that agriculture sector loan did not exceed 6 percent in commercial banks.

Sector wise loan and advances of Commercial and Development Banks (mid  July 2019)


S.NSectorPercentage of Total Loan
201720182019
1Agriculture Forest4.234.65.26
2Fishery0.120.110.14


  Percentage of Total Loan
201720182019
1Agriculture Forest5.55.966.24
2Fishery0.130.130.21

These data’s show that however, number of financial institutions is increased in last two decades, agricultural financing is not satisfactory. Agriculture Census data shows that farmers had most of the source of credit from non-institutional or informal types of source likes relatives, private lenders and others. If we observe sources of credit we can see 34.57% of holdings borrowed agricultural credit from relatives, 5.78% from undisclosed sources, while 8.68% borrowed from commercial banks, 12.61% borrowed from Agricultural Development Bank/Nepal and 15.68% from savings and credit cooperatives. In total scenario, only 21.82% of agricultural holdings borrowed agricultural credit. That means still 78.18% of agricultural holdings have no agricultural credit or investment.

Number, area of holdings and number of holdings reporting agricultural credit by total area of holding


Number, area of holdings and number of holdings reporting agricultural credit by total area of holding

ProvinceHoldings with credit by main source (%)
No. of holdingsHoldings without agricultural credit %CooperativesADB/N Commercial Bank/financial institutionFarmer's groupWomen's groupRelativesOther
Province 171714879.4816.6216.7612.29.6412.3129.712.76
Province 267292773.769.6618.7511.023.978.4239.129.05
Bagmati65877679.5425.237.424.5412.7616.11312.93
Gandaki41330085.8419.9712.0410.557.0615.3133.221.86
Province 569729378.4514.8413.739.9510.1514.0132.454.87
Karnali26177072.1416.923.874.3413.319.342.929.34
Sudurpaschim40987976.669.67.484.9214.5517.4736.489.51
NEPAL383109378.1815.6812.618.689.7412.9534.575.78

Examining Provincial data, we can see 27.86% of holdings in Karnali Province have agricultural credit, the highest among the Provinces. Province 2 comes second with 26.24% and Sudurpaschim Province with 23.34%. Similarly, 14.56% of holdings in Karnali province have agricultural credits from relatives and individuals and only 7% of credit from financial institutions like commercial banks, ADB/N and cooperatives. Sudurpaschim province is among the provinces having least agricultural credit from financial institutions, which is 5.13%.

Investment in agriculture is directly related to production and food security. Less investment in agriculture results less production and high food insufficiency. Agriculture Census report reveals food insufficiency in various provinces, among all Provinces Karnali province has the highest insufficiency of own produce for household consumption, which is 74.71%. Similarly, Gandaki Province has 67.80%, the second highest insufficiency of own produce for household consumption. Overall scenario showed that 59.91% of holdings reported that they are insufficient in food from their own produce. So, how are farmers coping with year round insufficiency of food? Income earned through own non-agricultural business, wage earnings (within district and outside district), pension, borrowings and other means of earning are adopted by many of the farmers for livelihood.

Province Total number of holdings Percentage of holdings reporting insufficiency of own produce for  household consumption
Province 1 717148 57.01
Province 2 672927 57.69
Province 3 658776 54.28
Province 4 413300 67.80
Province 5 697293 56.66
Province 6 261770 74.71
Province 7 409879 65.85
NEPAL 3831093 59.91
Source: NATIONAL SAMPLE CENSUS OF AGRICULTURE 2011/12

 ‘A declining long term trend in public investment particularly in agricultural support and productivity limits the productive capability in the agriculture and its ability to benefit from the rise in output prices.’ (Prof. Dr. Pyakuryal Bishwamber ; ‘Nepal’s Development Tragedy Threats and Possibilities’)

However declining, Nepal’s agriculture sector still has highest share in GDP. And there is still huge number of population depending on agriculture for livelihood. To fill the investment gap in agriculture and productivity an urgent review of investment financing strategy is needed.